Glossary Article: Heat Maps in Trail Cameras
What is a Heat Map in Trail Cameras?
A heat map is a graphical representation of data using a gradient of colors—typically ranging from cooler colors like blue to warmer ones like red—to signify varying levels of activity or intensity within a specific area. In the realm of trail cameras, heat maps are employed to visualize the spatial activity patterns of wildlife or other detected entities. These maps are derived from the cameras’ Passive Infrared (PIR) sensors, which detect motion based on infrared radiation changes. Heat maps help users pinpoint areas of frequent activity, offering a consolidated view of where animals or other subjects are most active over time.
Advanced trail cameras or software platforms such as DeerLab, HuntPro, and HuntStand are commonly used to generate these heat maps. They aggregate data from multiple photo-triggered sightings, allowing hunters, researchers, and property managers to make informed decisions.
How Are Heat Maps Used?
Heat maps serve as a powerful tool for maximizing the functionality of trail cameras. They visually summarize hotspots of activity, enabling users to optimize their strategies in wildlife monitoring, hunting, property surveillance, and beyond. Below are detailed use cases:
####1. Wildlife Monitoring and Research
- Tracking Movement Patterns: Heat maps reveal migratory routes, feeding sites, and territorial boundaries. For instance, researchers analyzing deer movement can identify specific areas frequented by bucks during dawn or dusk.
- Behavioral Studies: These maps are pivotal for studying animal habits both in the wild and in zoological settings. For example, researchers can use heat maps generated by cameras like the Milesight Panoramic Camera to monitor zoo animals and improve their habitat conditions.
- Biodiversity Analysis: Over time, heat maps can help in estimating species density and identifying ecological hotspots, making them invaluable for conservation efforts.
####2. Hunting and Property Management
- Strategic Game Hunting: Hunters can leverage heat maps to determine the most active zones for setting up blinds or tree stands. For example, platforms like DeerLab use aggregated data to highlight specific animal movements, aiding in precise equipment placement.
- Camera Placement Optimization: Heat maps guide users in repositioning trail cameras for optimal surveillance. If a camera’s detection zone aligns with a hotspot, it enhances the chances of capturing high-quality images or videos.
- Property Surveillance: Beyond wildlife, heat maps can help monitor unauthorized human activity on private property, bolstering security measures.
####3. Other Applications
- Retail and Business Operations: In commercial contexts, heat maps can analyze customer movement patterns in stores, banks, and museums to optimize layouts and improve customer service.
- Event and Crowd Management: Heat maps help planners manage high-traffic zones in large venues like amusement parks, ensuring effective crowd control.
Examples of Heat Map Applications
DeerLab aggregates trail camera photos to create heat maps depicting animal movement. By analyzing these maps, hunters can identify patterns, such as when a specific buck frequents an area, and strategically place tree stands or feeders.
HuntPro integrates heat maps into its comprehensive system, which includes features like animal tagging, activity analysis, and population surveys. These heat maps aid in managing properties and herds more effectively.
Example3: HuntStand’s Pro Features
HuntStand offers exclusive heat map functionality to its Pro users. These maps allow hunters to visualize game activity and movement predictions, enhancing decision-making for hunting or property surveillance.
Technical Details: How Heat Maps Work
####1. Role of PIR Sensors
Trail cameras use Passive Infrared (PIR) sensors to detect motion by measuring infrared radiation from moving objects. When a warm body, such as an animal, moves within the detection zone, the sensor triggers the camera to capture an image or video.
####2. Data Aggregation and Processing
Heat maps are generated by aggregating data from multiple sightings over time:
- Data Grouping: Platforms like DeerLab group photos into “sightings” based on a 15-minute window to minimize redundancy.
- Visualization: The aggregated data is displayed on a satellite map, with color gradients representing different activity levels (e.g., red for high activity, blue for low activity).
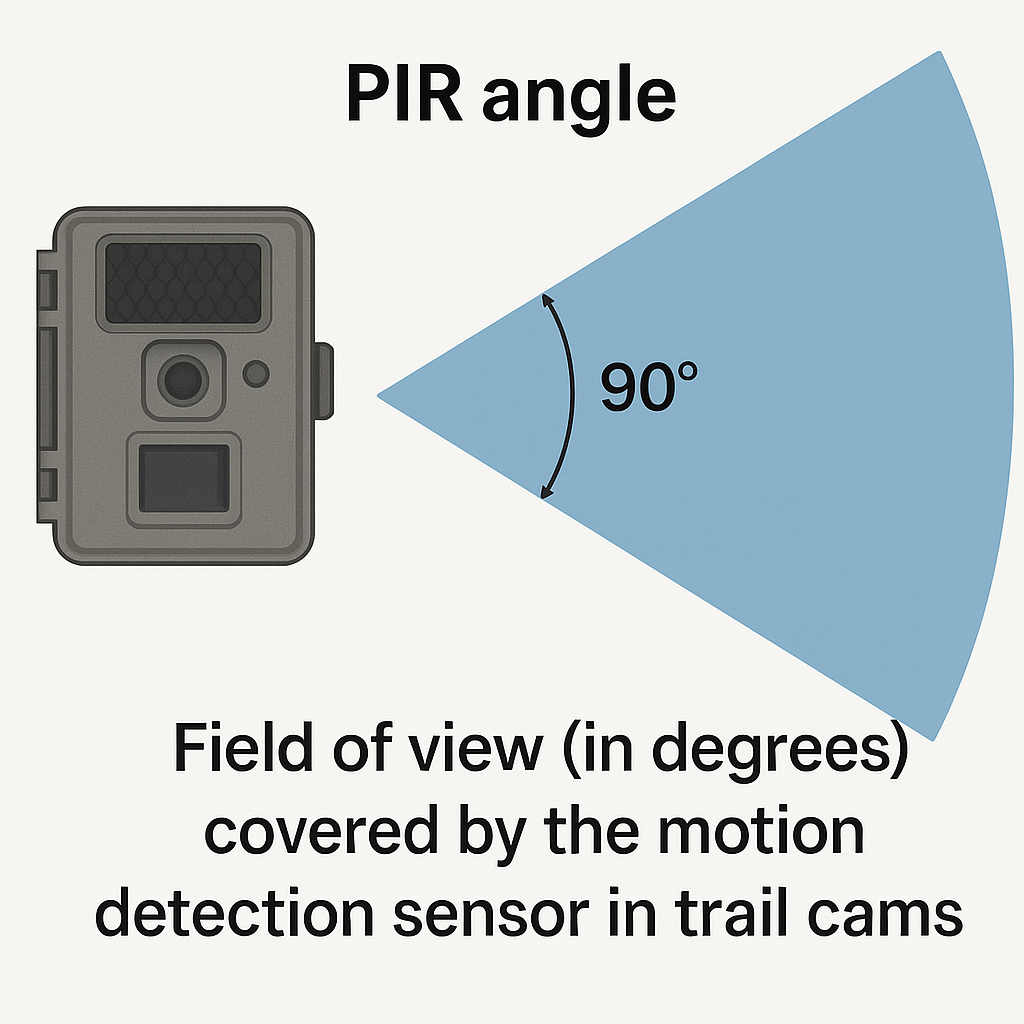
####3. Detection Zones and Field of View
Understanding the relationship between a camera’s detection zone and field of view is essential for accurate heat mapping:
- Detection Zone: The area where the PIR sensor detects motion.
- Field of View: The visible area captured by the camera lens.
Cameras like the Browning Spec Ops Elite HP4 excel in aligning these features for precise heat map generation.
####4. Factors Influencing Accuracy
Several factors impact the reliability of heat maps:
- Environmental Conditions: High temperatures can reduce thermal contrast, affecting PIR sensor accuracy.
- Camera Placement: Correct positioning ensures that the detection zone aligns with animal pathways.
- Camera Specifications: Models with faster trigger speeds and optimized detection zones produce more reliable data.
Benefits of Heat Maps
- Enhanced Visualization: Transform raw data into intuitive, color-coded formats for easy trend analysis.
- Optimized Camera Placement: Identify ideal camera locations to maximize data collection.
- Behavioral Insights: Gain deeper knowledge of animal habits and patterns.
- Efficiency: Reduce the time spent manually analyzing trail camera photos.
- Versatility: Applicable across various fields, from wildlife research to retail analytics.
Limitations of Heat Maps
- Data Dependency: Inaccurate or insufficient camera data can result in misleading heat maps.
- Environmental Sensitivity: Weather conditions and thermal variations may affect PIR sensor performance.
- Cost: Advanced trail cameras and software platforms with heat mapping features can be expensive.
Frequently Asked Questions (FAQs)
####1. Are heat maps available in all trail cameras?
No, heat maps are typically a feature of advanced trail cameras or software platforms like DeerLab, HuntPro, and HuntStand.
####2. How do heat maps differ from traditional camera data?
Heat maps aggregate and visualize data to display activity patterns, whereas traditional camera data consists of raw images or videos.
####3. Can heat maps track small animals?
Yes, but the effectiveness depends on the camera’s PIR sensor sensitivity and thermal contrast.
####4. What factors influence heat map accuracy?
Environmental conditions, camera placement, and the quality of the trail camera are key factors.
Conclusion
Heat maps significantly enhance the utility of trail cameras, providing a visual overview of activity patterns that aids in decision-making for wildlife monitoring, hunting, and property management. Advanced platforms like DeerLab, HuntPro, and HuntStand have revolutionized this feature by integrating it with AI and cloud-based systems, making it an indispensable tool for professionals and enthusiasts alike.